As my students have been developing their understanding of uniform acceleration, my colleagues and I have come up with two problem types for student practice. Much appreciation to Brian Frank for his writing about multiple representations, as it was a big motivator for me to pull this together.
Deploying the Model from an Incomplete Representation
We asked students to fully deploy the model of uniform acceleration based on an incomplete chunk of info. (Background: for our students, to “fully deploy the model of uniform acceleration” means to create all the representations they know[1], filling in all the values at every step.) We’ve been practicing deploying our model on a bunch of scenarios. What you see below come from practice as well as our test.
For example, this data table:
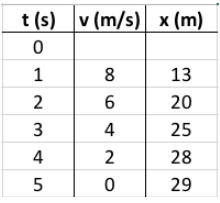
Students had to finish the table, then flesh out the model using a variety of representations.
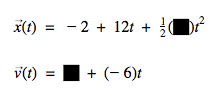
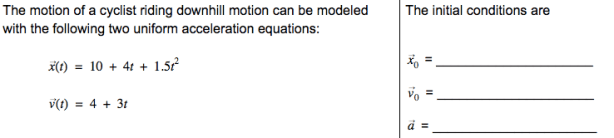
Here’s another, starting with this mathematical representation:
And finally, this velocity-time graph, which appeared on the test today:
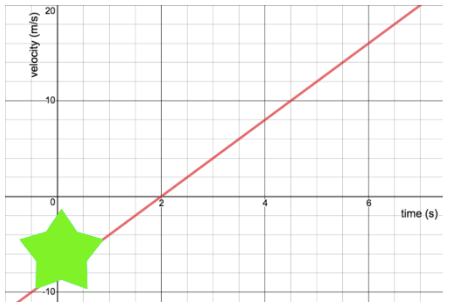
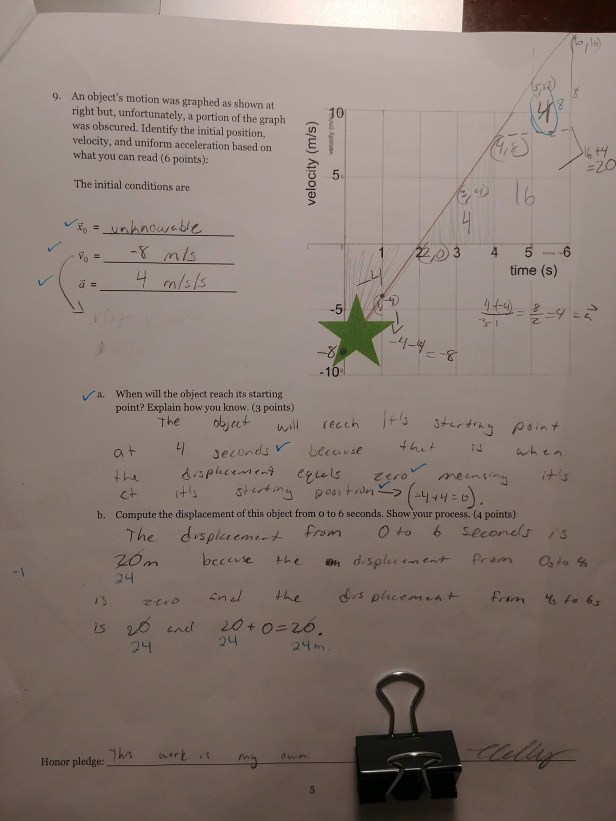
Here’s where we went from the above velocity-time graph. First, we asked for the initial conditions (position and velocity) as well as the acceleration. Most students did a decent job here. A design flaw in the graph we provided on the first version of the test (photo below) made it tough to read points and therefore calculate slopes. We updated for later classes and the screenshot above is the newer version.
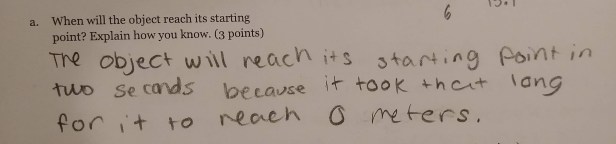
Next, we asked about when the object reaches its starting position. I absolutely love the explanation from the student below.
Finally, we asked about the displacement of the object over some time interval. Again, check out the work below to see how this student applied her work from the previous question to make her job easier on this one. Brilliant!
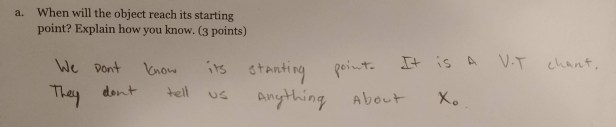
As y’all know, students are forever misreading velocity-time graphs as position-time graphs. Here’s a classic example of that mistake on this question:
Or, in this student’s case, confusing position with displacement:
Identifying Initial Conditions
Now, let’s back up from today’s test. Sort of late in the game, we realized kids who struggled with deploying the model on problems like those above were struggling to identify the initial conditions (velocity and position) and the uniform acceleration. That’s when we whipped up the “identifying the initial conditions” problems.
Again, these problems presented the students with a single representation (sometimes incomplete). Students almost unanimously agreed it was easiest to start with the mathematical representation:
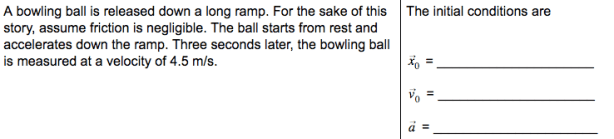
The verbal descriptions were also pretty simple:
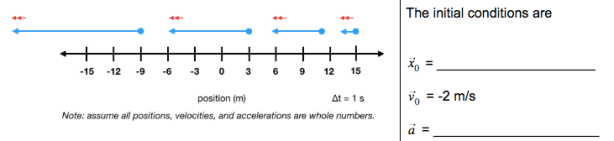
And for some reason, the motion maps continue to be a struggle. For this particular batch of kids and for this particular content timing, I opted to give them initial velocity, though it’s totally obtainable from this motion map:
Parting Thoughts
Both the incomplete representations and the initial conditions problems proved super helpful. I mean, of course they did or I wouldn’t be writing about them here. I keep saying that I’ve never taught kinematics with so many open-ended problems. Most of the time, our students are modeling a scenario. Then sometimes, we throw in a pretty traditional question they need to answer with the model.
Oh, and though you don’t see it here, we did a little with free fall. Most kids realize that the acceleration acting on an object thrown up in the air is uniform, even at the apex of the throw. First time ever that so many kids get it. I credit velocity-time graphs and data tables for helping them see it.
I remain baffled at why so many students find the motion maps to be so difficult. These same kids love them some data tables, which have exactly the same information.
Finally, Brian Frank’s Primer on Problem Solving with Multiple Representations is a great follow up.
[1] Our students know motion maps, position-time graphs, velocity-time graphs, acceleration-time graphs, verbal descriptions, mathematical representations, data tables. In some circumstances, we might ask them to add computational models.
